GA Statistics is a live statistics platform for enhancing General Assemblies of Sessions of the European Youth Parliament. The original idea was that it is interesting for session participants to be able to see in real time who is speaking in GA, and what they are talking about. GA Statistics lets you do this in the easiest way possible.
All you and your officials team have to do is tell GA Statistics what is going on in GA (when a committee makes a point, or a vote is held etc.) and we will give you a really nice way of visualising it. The feedback we have received from delegates so far is that an overwhelming majority found the GA easier to follow and more engaging when the GA Statistics platform was being used.
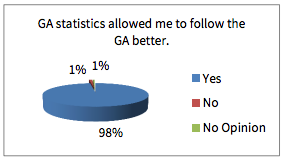
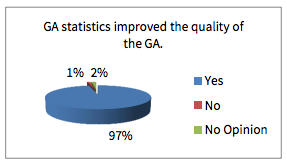
Responses from 150 participants at the Izmir 2015 IS
We are convinced that your GA can be more engaging and of higher quality with GA Statistics, but only if you use it correctly. This is why we have put together this guide to help you achieve this goal.
Prerequisites
- A stable internet connection for the board and each person who will be submitting statistics at your GA venue
- Motivation to implement GA Statistics fully — this is not something you can do half-baked.
GA Statistics is composed of four main modules. Statistics, Point Content, Voting and Gender Statistics.
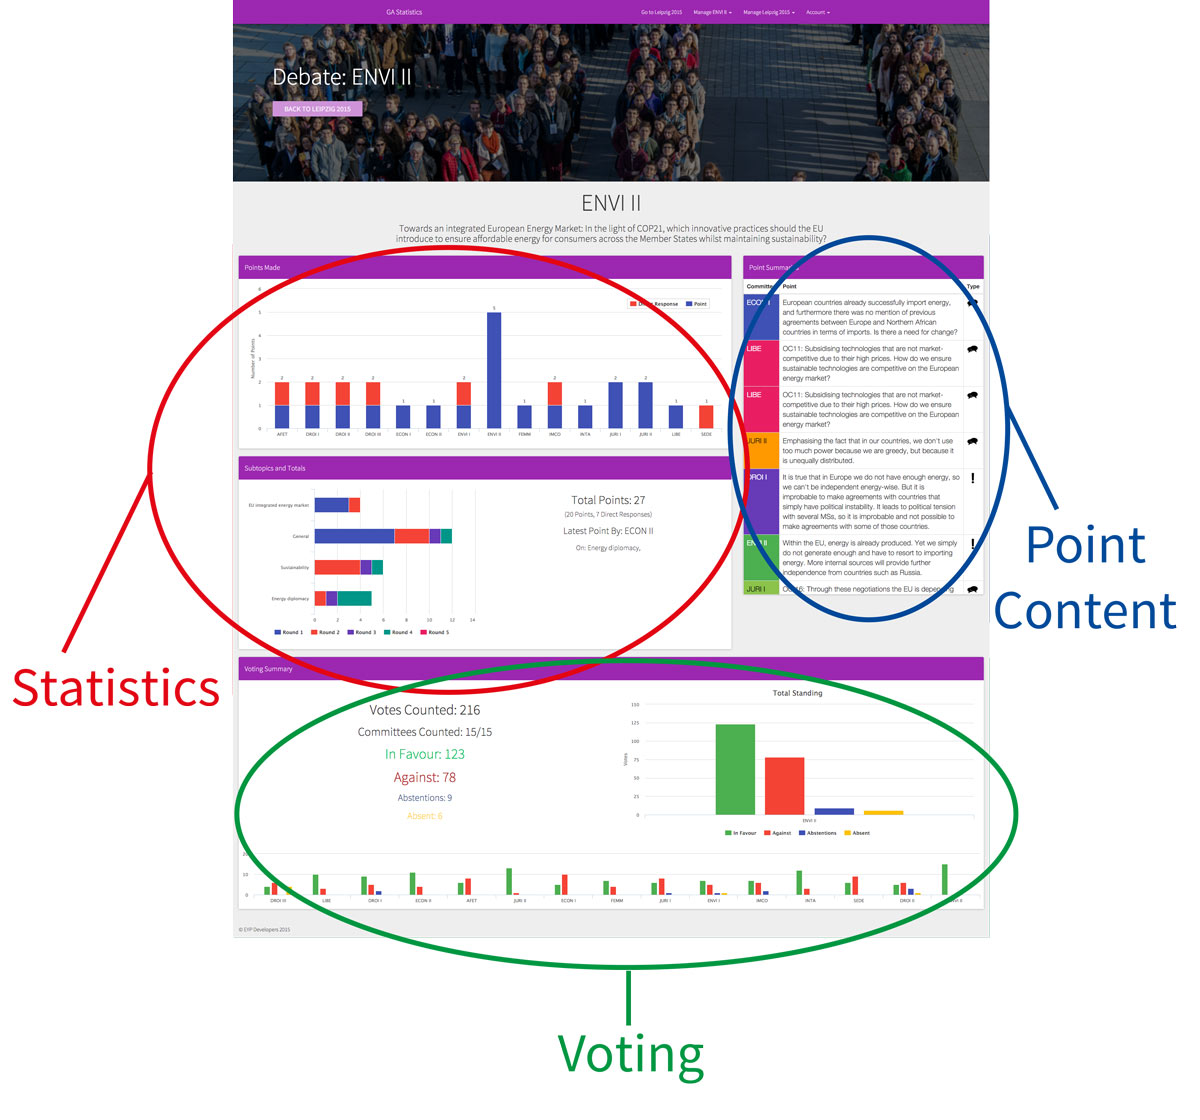
GA Statistics Modules
Statistics
Usually in the statistics module, chairs will submit a point every time their committee speaks in open debate, stating the subtopic of the point - what it was about.
As the points accumulate, GA Statistics provides some really cool insight into what is really happening in GA.
Are the points evenly distributed among the committees? Which committee had the most direct responses? Which subtopics have been addressed?
All this data is shown live in front of the audience, ideally projected behind where the board is sitting.
TLDR; Pretty Graphs
Point Content
As opposed to statistics only stating which topics have addressed during the GA, point content states what was actually said in each point.
Imagine it like a tweet for each point, shortly describing what the point was about. This provides a timeline of what has happened during the debates and is very helpful
in understanding what has already been said in a debate. You should consider whether you are going to need a dedicated group of individuals like Journalists or Organisers to manage these point summaries,
as it is a demanding job and can be difficult for beginner Chairs to do while managing their committees during GA. When the committees are being chaired by two chairs, even beginner Chairs should not have any problems with summarising the points. Advanced Chairs can also submit the summaries when they are chairing alone.
We recommend that chairs let their Delegates write down summaries of their own points on Post-It's before they even make the point. This will help the Chair who can use the Delegate's summary as a guideline and even the Delegate who actually needs to think about what to say before they have the floor. Trust us, it is worth the effort.
TLDR; Short summaries of each point
Running Order Statistics (with or without point content)
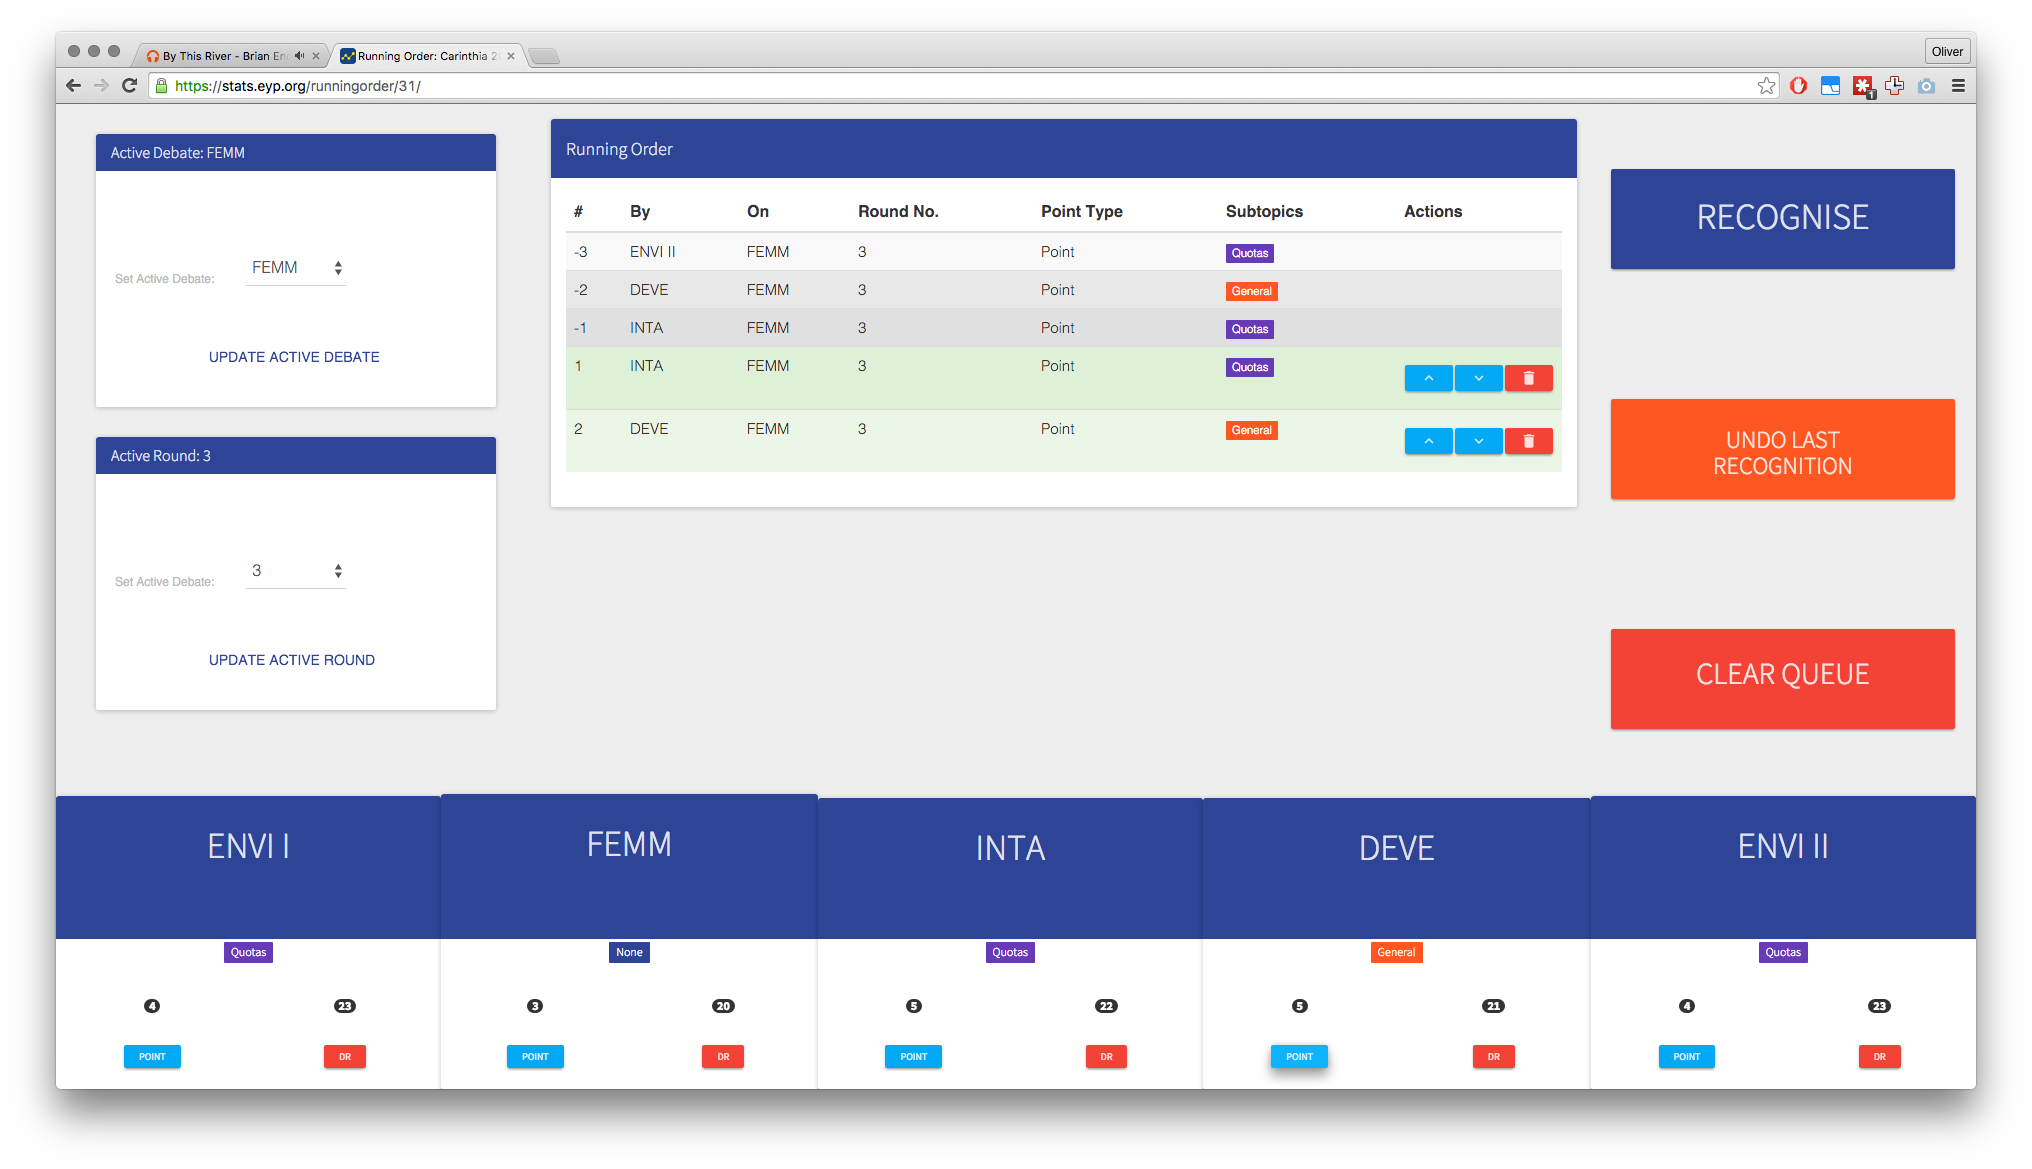
Running Order Statistics
Different to normal Statistics, where chairs notify GA Statistics once they have made a point, telling the platform which subtopics the point was on and what the point was about, Running Order Statistics gets chairs to tell the board what their next point will be about in advance. The board uses this information to decide the running order of the GA. Perhaps three points should be taken regarding asylum seekers before returning to the proposing committee? The running order is publicly displayed on the committee page, notifying the GA which committees will be speaking next. Once the board recognises a committee, the point is saved using the subtopic the chair predicted.
All Direct Responses are automatically placed first in the queue, and the subtopic is automatically assigned to that of the last recognised point. If a chair at any point in time predicts the wrong subtopic - or the delegate changes his mind and speaks about something different, each chair can edit the subtopics of all points they submitted on the same page they use to predict the next subtopic.
A note on Running Order Statistics
We think that running order statistics are the most efficient use of GA statistics as it can significantly
increase the quality of GA, however, at the time of writing — Running Order Statistics are fairly new
and as such have not been tested as much as the other statistics types — there may be small bugs
particularly concerning the running order page itself. These are usually fixed by refreshing the browser window,
but errors can crop up. Please report bugs if you should find any!
Voting
The voting module does exactly what it says on the tin - it allows digital voting. Digital voting is good for a few reasons, the maths is never wrong, voting is more
transparent since you can see how each committee has voted, and - our personal favourite - if it is a close vote, there is an incredibly tense atmosphere as everyone watches the votes come in.
Again, the chairs submit this data from their phones.
TLDR; Digital Voting
Gender Statistics
Gender statistics allow you to track the gender equality of your General Assembly. A single person tracks gender statistics during GA, and the results are shown only to the
session admin. Gender statistics are not only useful for you to keep track of the equality of your GA, but it also helps the organisation as a whole, as it allows the International Office
to view and analyse gender statistics for the whole EYP.
TLDR; Tracking Gender Equality
What should I pick?
You need to pick at least the Statistics or Point Content module — the voting and gender statistics are optional but recommended!
Now that you know what GA Statistics is composed of, it is good for you to know in which ways you can submit this data to the GA Statistics platform and which one suits your session best.
Statistics Only
Only switches on the statistics module.
Point Content Only
Only switches on the point content module.
Joint Form Statistics
Allows whoever is submitting data to GA Statistics to submit both Statistics and Point Content from one form.
Split Form Statistics
Both the Statistics and Point Content module will be activated - but each statistics type will be submitted from different forms.
Signing up is easy. Just head over to /create_session/ and enter your session's details.
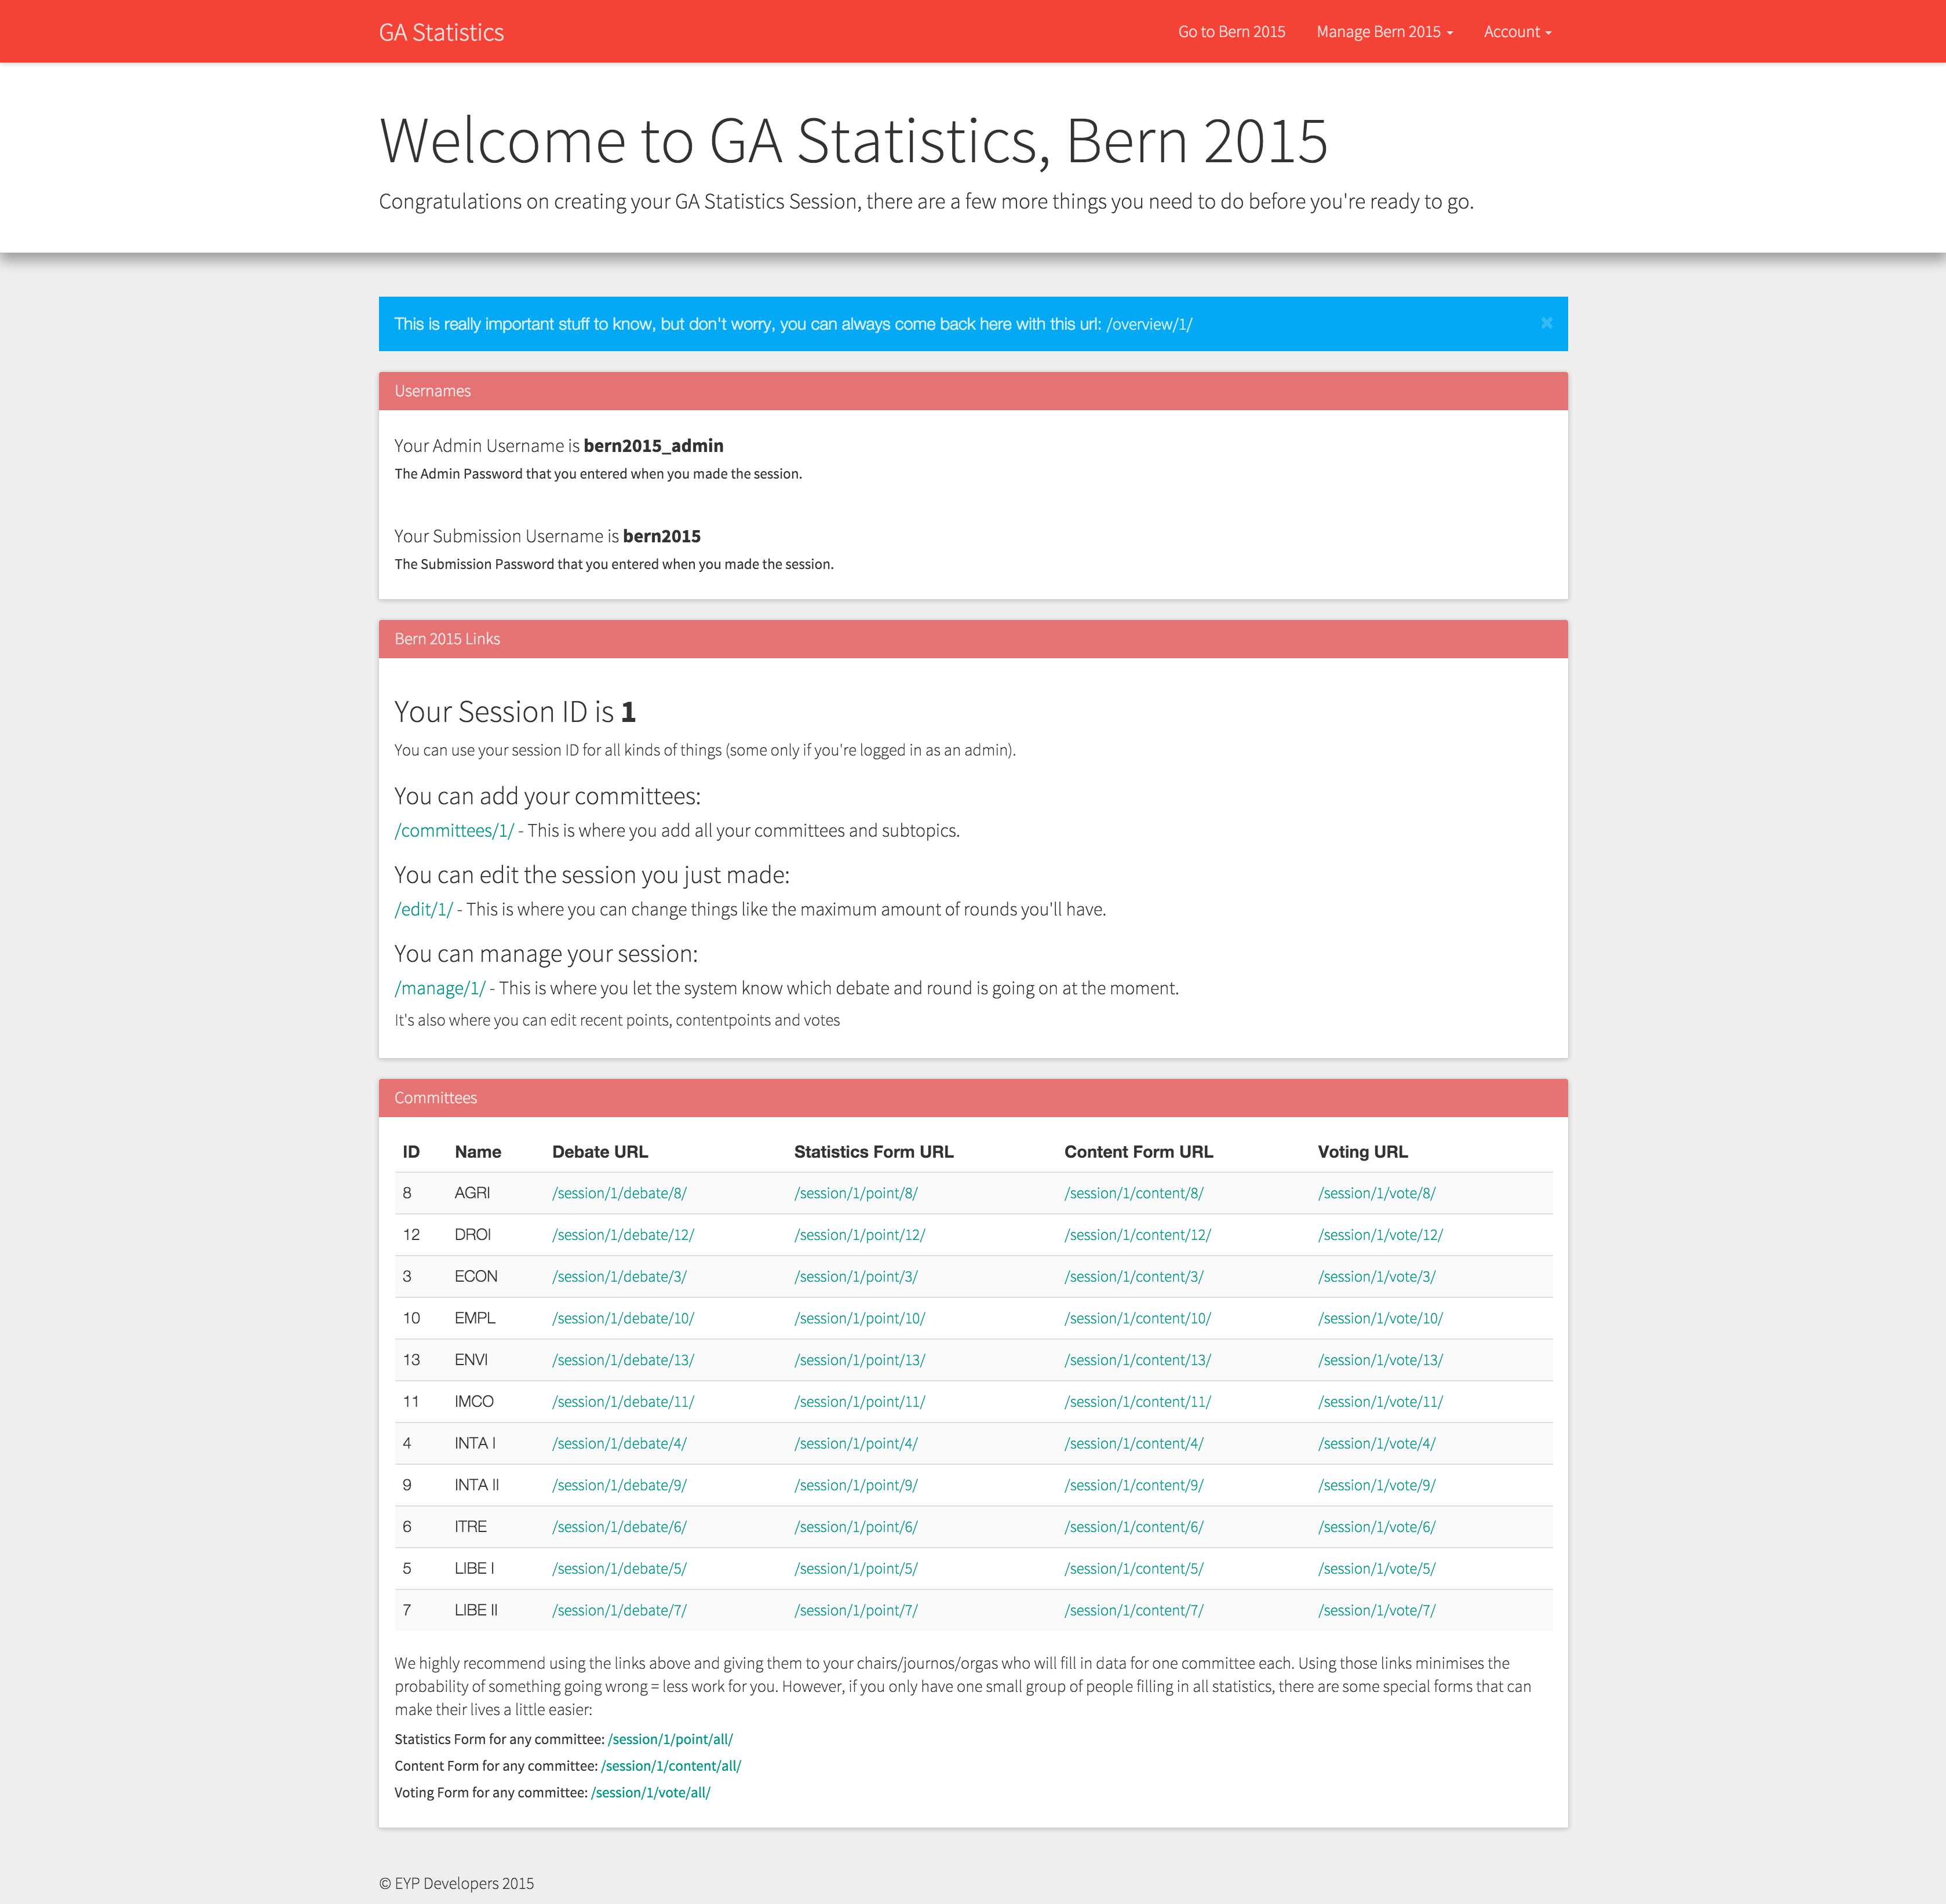
Create SessionI have created my session. What next?
You should log in by opening the account dropdown in the top right corner! Your new username is sessionnameyear_admin, where sessionname is the name of the session you put in without spaces and in all lowercase letters. Use the password you entered when you created the session. Then you should start customising your session by adding committees and their topics.
As a GA Statistics admin, you have got a few tools available to you to help you manage your session. There are three main tools at your disposal. When you are on your session page and logged in as the admin of the session, there should be a dropdown menu in the top right hand of the screen with all three tools, debate management, committee management and session settings. There is also a management overview that contains all kind of useful information for you.
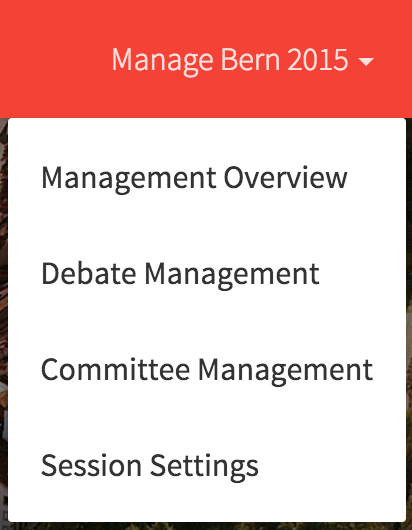
GA Statistics Admin Tools
Management Overview
The management overview gives you an overview of all links you have at your disposal. This includes all links to the relevant forms for each committee.
If you are not quite sure where to go at any point, open the management overview, it should be able to point you in the right direction.
GA Statistics Admin Tools